Overview
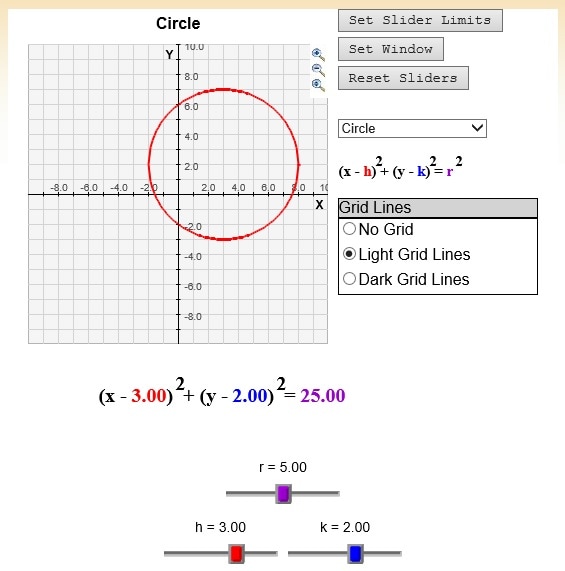
(From website) This activity allows the user to experiment with changing constants and coefficients in a conic section.
Curator: Darrell Glover
Brief Description of Tech Tool: This tech tool allows the user to see how changing the various portions of an equation will affect it's graph; it utilizes slider bars in order to show the changes in real time as they are manipulated. Various types of graphs are available for manipulation such as circles, ellipses, parabolas, and hyperbolas. Many worksheets are also available for use with the tool making it useful for everything from an introduction to the functions of these shapes to the concepts of them as cross sections of conics.
Technical & Cost considerations: This tool is free from the Shodor.org's Interactivate website and should run on any computer with an internet connection.
Evaluation
Description of Learning Activity
Depending on the lesson, this tool has many potential learning activities that could be associated with it. From the perspective of geometry, it would be useful for letting students freely explore the idea of conic cross sections represented as graphs that students would be familiar with. After a brief introduction to the topic (potentially from one of the worksheets) the students could explore the connection between the various graphs and which conic cross section they represent.
1. Learning Activity Types
- LA-Present - this tool is useful for presenting the connection between the function form and geometric form of a shape.
- LA-Present-Demo - the user is able to manipulate slider bars to demonstrate how changes to the graphs of various functions translate in real time.
- LA-Explore - the tool contains various types of graphs and their functions allowing exploration of their translations; there are also numerous worksheets available which can support further investigations utilizing the tool.
2. What mathematics is being learned?
Standards
NCTM:
- Analyze properties and determine attributes of two- and three-dimensional objects
- Understand and represent translations, reflection, rotations, and dilations of objects in the plane...
- Draw and construct representations of two- and three-dimensional geometric objects using a variety of tools
Common Core (non-specific, geometry only):
- Experiment with transformations in the plane
- Understand and apply theorems about circles
- Translate between the geometric description and the equation for a conic section
Proficiency Strands
- conceptual understanding - the ability to view and manipulate the functional and graphical representations of the data on screen at the same time, the user can better link the two together
- strategic competence - the available worksheets provide guided exploration of the various ways to utilize the tool for solving problems
- adaptive reasoning - the tool's various data representations can aid in providing various avenues to solve problems
3. How is the mathematics represented?
The tool uses graphical and numerical representations in addition to being manipulatable. The slider bars provide a virtual manipulative factor that allows the tool to provide instant feedback on the user's inputs. This dynamic representation provides an important link between the graphical and numerical facets and provides for a more conceptual understanding of the topic. The one part that would be a valuable addition would be a three-dimensional view allowing the conic cross section application to be viewed at the same time. This would provide a visual of the next step that some of the worksheets suggest highlighting.
4. What role does technology play?
One main advantage to this tool is the ability to see multiple representations of data at one time, graphical and numerical. This provides for a better connection and understanding of the two. The main disadvantage is that, for the purpose of geometry, the ability to see a three-dimensional representation of the conic cross section is absent. There is a separate tool but the labeling (circle, parabola, etc) isn't on it and the slider bars are slightly more difficult to maneuver effectively. I would have liked to have seen the three-dimensional representation on this tool to provide for a connection among all three parts - two- and three-dimensional graphs/figures and its function.
Affordances of Technology for Supporting Learning
- Computing & Automating - this tool automates the graphing of a function by virtue of manipulatable slider bars.
- Representing Ideas & Thinking - the tool represents how changes to certain portions of a function translates to its graph.
- Accessing Information - the page contains tabs with numerous worksheets and guiding questions for use with the tool and how the activities align with Common Core and some other state standards.
- Capturing & Creating - users are able to create their own various graphs/functions by manipulating the slider bars.
5. How does the technology fit or interact with the social context of learning?
This tool can be used by individuals or small groups (the website recommends no more than four people). Even though the tool itself can only by manipulated by one person, the nature of the tool lends itself to small group discussions about the topic. The clarity of the graph may not translate well to whole-class projections but with the function area, the general idea of various translations would still be preserved.
6. Additional Comments
Although this tool came up in a search of geometric tech tools, it appears to be much more useful for the exploration of algebra and functions. With some expanded instruction (provided by some of the worksheets available) a teacher can show how the graphs/functions are a way to represent cross sections for various conics, however the tool itself does not show this.
