Overview
Curator: Erica Skrip
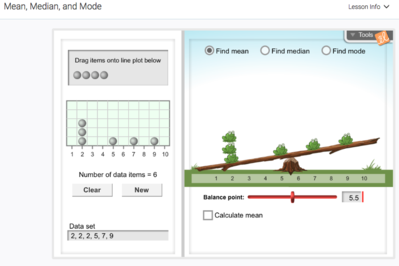
Brief Description of Tech Tool: Mean, Median and Mode is offered by Explore Learning, a site that offers interactive learning tools to enhance the learning the math and science. This particular activity is a lesson designed with leap frogs that allows students to build a data set and find the mean, median, and mode. Explore the mean, median, and mode illustrated as frogs on a seesaw, frogs on a scale, and as frogs stacked under a bar of variable height. Explore Learning allows instructors to assign these learning activities to classes of students. Within the 'free' capabilities, this activity offers a student exploration sheet, a teacher's guide and vocabulary resources. Additional exploration activities can be obtained by subscribing to Explore Learning's services.
Technical & Cost considerations: Explore Learning is an internet-based site that using 'learning gizmos' (interactive activities) to promote the learning of math and science. In order to use these activities, teachers or students must create a login username and password. Many of the capabilities of this activity and of Explore Learning come included within a free membership. However, further exploration activities and such come with a subscription. Many of the learning activities also use flash players which must be properly downloaded or updated on the device being used.
Evaluation
Description of Learning Activity
This learning gizmo is an ideal tool for the introduction of content or review, depending on how it is implemented. If you do not intend to use the student exploration activity, this tool would be best used as review. The gizmo has some explorative and investigative properties, although its use would be more beneficial in reinforcing concepts already learned such as mean, median, and mode without using the student exploration worksheet. If you intend to use the student exploration activity that accompanies this lesson, students may be more able to explore and learn the ideas of mean, median, and mode. The exploration activity allows students to investigate the effects of entering and changing the data and develops an understanding of these basic statistical measurements. There are also assessment questions that accompany the lesson to be used. These questions also offer students feedback based on their correct or incorrect responses.
1. Learning Activity Type
- LA-Practice - This learning gizmo can easily be used for students to practice calculating basic statistical measurements. Additionally, this tool will offer feedback whether or not students responses are correct improving their practice.
- LA-Present - If the lesson is used WITH the student exploration activity...
- LA-Present-Demo - The activity and tool together work in combination to present students with probing questions and tasks that in turn demonstrate and explain how mean, media, and mode are calculated and influenced by various sets of data.
- LA-Present-Explain - The activity and tool together work in combination to present students with probing questions and tasks that in turn demonstrate and explain how mean, media, and mode are calculated and influenced by various sets of data.
- LA-Explore - Students are able to use the learning gizmo to create and alter various sets of data. Based on the data sets, students are able to explore the effects on basic statistics such as mean, median and mode
2. What mathematics is being learned?
The intent here is to describe the mathematics being learned and how it fits with your learning goals. Do this first by listing standards and proficiency strands and then with any additional discussion of what is being learned.
Standards
NCTM:
Formulate questions that can be addressed with data and collect, organize, and display relevant data to answer them
- Select, create and use appropriate graphical representations of data, including histograms, box plots, and scatter plots
Select and use appropriate statistical methods to analyze data
- Find, use and interpret measures of center and spread including mean and interquartile range.
CCSS:
- Summarize, represent, and interpret data on a single count or measurement variable
HSS.ID.A.1
- Represent data with plots on the real number line (dot plots, histograms, and box plots).
HSS.ID.A.2
- Use statistics appropriate to the shape of the data distribution to compare center (median, mean) and spread (interquartile range, standard deviation) of two or more different data sets.
HSS.ID.A.3
- Interpret differences in shape, center, and spread in the context of the data sets, accounting for possible effects of extreme data points (outliers).
Proficiency Strands
- conceptual understanding - When using the student exploration activity, students are more likely to develop a conceptual understanding. The worksheet walks students through a series of probing questions and tasks that work to ensure students know more than isolated facts and methods.
- procedural fluency - Students must be comfortable with making calculations. This activity asks students to make such calculations in order to compute the basic measures of central tendency. In doing so repetitively, students increase their procedural fluency.
- adaptive reasoning - In the extension pieces of this activity, students are forced to think logically about the relationships between the sets of data given and the resulting measurements of one-variable data.
- productive disposition - The activity attempts to appeal to students by using 'adorable' leap frogs in the learning activity. In doing so, establishing positive thoughts and ideas about the use of the math involved.
Additional comments on what is being learned
Students will...
- Create and interpret line plots (dot plots) of data.
- Understand the concepts of mean, median, mode, and range.
- Find the mean, median, mode, and range of a set of numbers.
- Compare how the mean, median, and mode are affected by outliers and by the overall shape of the data set. (Extension)
3. How is the mathematics represented?
Explore Learning offers what they call, "Learning Gizmos." These gizmos are interactive technological tools where students engage in various learning activities. The activity itself is interactive and accompanied by a hard-copy worksheet, a student exploration activity. Students use a set of leap frogs and a see-saw to model the measurements requested. There is also a histogram visual that models the same information. Both models are able to be manipulated by the student.
4. What role does technology play?
In this tool, the technology allows students to quickly generate sets of data, both self-created and randomly generated. In doing so, they are able to complete a larger quantity of practice. This helps students make conclusions about the various effects altering data can have on measurements like mean, median and mode. The technology in this case also offers instant feedback. Once students have answered the assessment questions, the activity lets them know if they are correct or not while offering additional feedback about why or why not they are correct.
One of the main disadvantages of this tool is it's limited capabilities without a subscription to Explore Learning. Without the subscription still offers and adequate lesson, but many possibilities could exist with the subscription.
Affordances of Technology for Supporting Learning
- Computing & Automating - This tool allows students to use a see-saw in order to make calculations such as mean, median and mode.
5. How does the technology fit or interact with the social context of learning?
This learning tool itself is designed for individual student work. Likewise, the student exploration activity is designed for individual completion. If social interaction is needed, students could be assigned to partners and groups while still completing their own individual work. Partner work could also be used where one student operates the technology while another monitors their work using the student exploration activity. (Rotate and switch where necessary).
6. Additional Comments
From my investigating this learning tool alone, Explore Learning seems to be a site with a lot to offer both teachers and students. It appears to have the capability of building classes which makes me think you would also be able to monitor the success of your individual students as well. It seems that even the free application has a lot to offer and the subscription would probably be even more useful!
